Go vs Node vs PHP vs HHVM and WordPress Benchmarks
I have been impressed with the performance I’m seeing with Vultr VPSes, so I decided to do an experiment to see what the maximum performance could be.
I created a simple Hello world program in Go, Node.js and PHP, then tested them with ApacheBench 2.3.
Here are the three programs I used.
Go 1.4
package main

import (
    "fmt"
    "net/http"
)

func handler(w http.ResponseWriter, r *http.Request) {
    fmt.Fprint(w, "Hello world from Go")
}

func main() {
    http.HandleFunc("/", handler)
    http.ListenAndServe(":4000", nil)
}
Node 0.10.33
var http = require('http');
http.createServer(function (req, res) {
    res.writeHead(200, {'Content-Type': 'text/plain'});
    res.end('Hello World from node');
}).listen(3000, '127.0.0.1');
PHP 5.6.6 with Opcache enabled
<?php
echo "Hello world from PHP";
These benchmarks were run on a Vultr server with 768MB of RAM and a single 3.4MHz CPU with nginx 1.6.2. To perform the benchmarks I ran the following ab command three times to warm up, then I ran three more runs and averaged the second group of three.
ab -q -n 5000 -c 25 localhost/
WordPress had WP Super Cache enabled. Without it WordPress was getting around 30 requests/second.
Without further ado, here are the results. Higher is better.
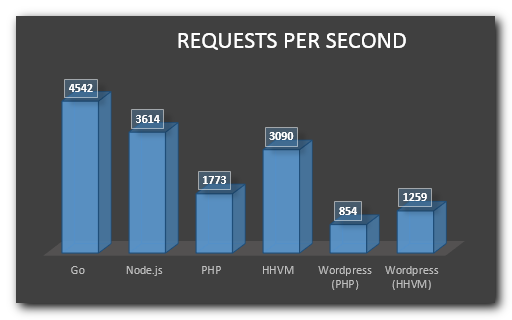
Here’s the data in tabular form
| Test Type | Requests per second |
|---|---|
| Nginx | 17,791 |
| Go | 4,542 |
| Node.js | 3,614 |
| PHP | 1,773 |
| HHVM | 3,090 |
| WordPress (PHP) | 854 |
| WordPress (HHVM) | 1,259 |
Go is the clear winner, but I was surprised to see how close HHVM was to Node. I was also impressed that with HHVM, WordPress was approaching a simple PHP script. Of course that was with the caching plugin in place.
I planned to include the results of nginx serving a static file in the chart, but it made the other results hard to distinguish at a whopping 17,791 requests/second.
Lastly, I was concerned to find that sometimes the HHVM results went into the toilet. Most of the other benchmarks were fairly stable, but HHVM would average over 3,000 on the first three runs, then drop off on the next three. In one case it hit around 700, so something was clearly wrong, but I’m not sure what. I had already fixed the nf_conntrack_max issue, but it could be something else along the same lines.
My takeaway is it’s a great time to be a web developer. Getting WordPress to hit over a thousand requests a second on a $5/month server is impressive. And it’s only getting faster!
I’m curious what PHP 7 would look like in that comparison. I’ve seen some reports that it gets within the range of HHVM.
You mentioned that the WordPress tests had WP Super Cache enabled. From the numbers that you posted I’m assuming that you had configured for “Use PHP to serve cache files.” and not “Use mod_rewrite to serve cache files. (Recommended)”. If it was in the mod_rewrite mode ( can work with Nginx config options too ) I would have expected the numbers to be much higher.
Were there any failed requests during these tests?
Hi Joseph – You’re right, I was using PHP to serve the cache files. I thought mod_rewrite would only work for Apache when I ran the benchmark. Nope, I didn’t see any failed requests.
Thanks for measurements :)
Testing WordPress with WP Super Cache activated is not very helpful though. If static caching is configured correctly, PHP doesn’t even load, so your measurements would be meaningless. A dynamically served page, with a primed object cache would be a more useful measurement.
WP Super Cache was using PHP to serve the files, but I was looking to see how well WordPress could perform, which is very meaningful to me. If you want to see how PHP is performing, look at that benchmark :)
Don’t output (it’s slow), better save the string to a var
Also check these – mongoose and its fork civetweb, monkey web server
For example (with WeighHTTP.exe -n 10000 -t 4 -c 4):
Finished in 1 sec, 549 millisec and 999 microsec, 6451 req/s, 863 kbyte/s.
Requests: 10000 total, 10000 started, 10000 done, 0 succeeded, 10000 failed, 0 errored.
Status codes: 0 2xx, 0 3xx, 10000 4xx, 0 5xx.
Traffic: 1370000 bytes total, 1370000 bytes http, 0 bytes data.
Only php:
PHP Version 5.6.8 x64, Win7 x64, i7-3610QM (laptop)
It would be faster to avoid output, but that wouldn’t be realistic test for a web app. I hadn’t heard of Civetweb before. Thanks for the pointer, I’ll take a look.
Hey, I’m doing the same stress tests as you these days, but a bit easier with help of loader.io.
I agree that it’s more realistic to output the result as HTML. By not outputting though, languages like Go (I’m into it right now) are a LOT faster than PHP. Which means there’s a huge freedom for inside pre and generic calculations as performance is great there. BUT, with Go I’ve recently came into a problem actually parsing dynamic templates like blog list for example (using html/template). Looks like things work a lot different here, not like in scripting languages like PHP (also, there’s opcache, fastcgi etc. and Go app is just a plain app). That resulted in a much slower performance than PHP, was driving me really crazy, but after a little more research some guy proposed a solution of caching templates, which resulted in Go beating PHP 3x times.
But that leads to another problem ;) By caching vars and templates at program initialization (certainly, this thing at once differs from PHP way of thinking) – we get the same data at each user’s request. And here’s where I’m keeping researching further…
If you’re interested, here’s a thread in go-nuts:
https://groups.google.com/forum/#!topic/golang-nuts/Ogn1xjUl2OE
With PHP 7 and Go 1.5’s new garbage collector I’m curious to see what the differences are.
Any chance you could run these benchmarks again?
Ideas for you to consider:
1. fmt.Print does a lot more than you need, why not use io.WriteString(wtr, “Hello world”)
2. You should use the same hello string for every language. For fairness.
3. Go 1.5 defaults to GOMAXPROCS = #CPUs, but in Go 1.4 you were only using a single CPU since you didn’t set this… You can set it using the environment variable or by calling runtime.GOMAXPROCS, but if you are using a new version of Go you don’t have to worry about this anymore.
4. ab is a really flawed tool, a similar, but much better tool is wrk https://github.com/wg/wrk
5. Go 1.6 will be out in a day or two, it might be worth running again.
@voidlogic Thanks for the ideas. They’re excellent points.
Go 1.6 on MacBook Pro Retina 15inch 2015, 2,2GHz Core i7, 16GB RAM, running Sniper and replaced `fmt.Fprint(w, “Hello world from Go”)` with `io.WriteString(w, “Hello world”)`:
$ sniper -c 100 -n 10000 http://127.0.0.1:4000
Transactions: 10000 hits
Availability: 100.00 %
Elapsed time: 1.34 secs
Document length: 147 Bytes
TotalTransfer: 1.40 MB
Transaction rate: 7447.52 trans/sec
Throughput: 1.04 MB/sec
Successful: 10000 hits
Failed: 0 hits
TransactionTime: 13.352 ms(mean)
ConnectionTime: 6.818 ms(mean)
ProcessTime: 6.533 ms(mean)
StateCode: 10000(code 200)