Monitor Disk Activity in Windows
I’ve had no trouble finding processor, memory and network monitoring tools on Windows. Process Explorer from SysInternals does a great job of showing processor and memory use (overall and for each process) and NetStat Live displays incoming and outgoing network traffic. The only thing missing was an easy way to see what processes were using the disk.
Every once in a while my hard drive begins churning and it’s a little disconcerting to have no idea what it’s doing. Nothing stands out with high CPU or memory use and the network traffic is all but nil.
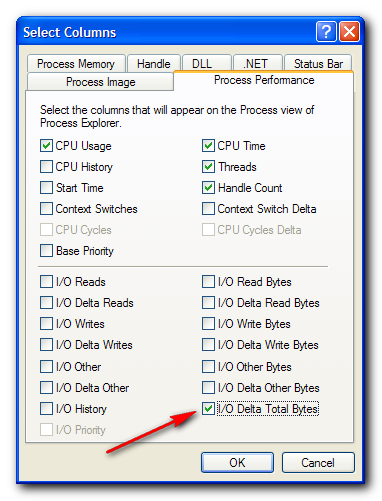
I searched high and low for a tool to show processes ordered by current disk activity and eventually found what I was looking for in Process Explorer. The trick is to enable the following three columns one column: I/O Delta Total Bytes
I/O Delta ReadsI/O Delta WritesI/O Delta Other
I didn’t know about the I/O Delta Other until I was running a disk scan. It was scanning thousands of files so there was obviously disk usage, but the process had no reads or writes. I turned on other and it shot to the top of the list with a few hundred a second.
Next time your hard drive starts churning and you want to know what’s causing it, get Process Explorer, go to View -> Select Columns, Process Performance and enable the three columns column I mentioned above. Click on the column header and the offending process will leap to the top.
Update 11 Oct 2012 – You can also use the Disk Activity tab in the built-in Resource Monitor. Instant Fundas has more details.
Nice tip, thank you
You’re welcome. I’m glad you found it useful. :)
Thanks!
Lots of disk activity seems to be originating from svchost.exe (windows services host process). Now, this hosts many services, and procexp.exe can’t drill down to determine which service specifically is causing the disk activity! Any ideas?
My poor hard drive is being hammered, and has been for the past hour or so, with thousands of seeks per second. This is destroying my drive, and I want to find out how to stop this!!!
@Anoncow If you mouse over svchost.exe in procexp it will display a list of all the embedded services. Then you can disable each service one by one until your disk stops thrashing.
Excellent tip!
I’ve used Process Explorer for a long time. I always just displayed the I/O Reads/Writes/Others … that only gave the total. This gives the current active … that’s what I wanted all along.
Greatly appreciated!
This is usufule, thanks.
Thanks so much for this tip. Mysterious constant disk activity was driving me crazy.
Thanks so much! A really useful tip.
Cool
Exactly what I was looking for. Thanks
You’re welcome :)
At least with Process Explorer v11. 33, the word “Bytes” is added to the column name, as in “I/O Delta Read Bytes.” I mention this in case you are looking for “I/O Delta Read” and can’t find it :).
Also, the most useful column for me is “I/O Delta Total Bytes.” That sums the three others (read, write, other) into a single column. I use just that one and not the other three.
It is amazing to me that the #1 complaint users have is that there computer is running slow, and most of the time it is becuase of excessive hard drive activity, yet 1) manufacturers make the hard drive activity light tiny and hard to see and 2) Windows does not include a HD activity monitor (until you install Process Explorer. I wish mfgs would put a big HD activity light on the monitor frame.
Also, the many culprits recently have been indexing and backup programs. Even though they all claim to stop or slow down when the computer is in use, that never seems to happen.
Why can’t the designers fix these things? Oh well, job security for techs like us.
@David The total delta bytes column is brilliant. I’d never noticed it until now. Thanks for pointing it out!
You’re right, most of the time when my machine is sluggish, it’s due to some sort of disk activity (usually periodic backups or a scan)
For my next machine I plan to get a small but blazingly fast SSD for the OS, and a larger regular drive for everything else. Though, if SSD prices come down, I’d go with one big SSD.
This video http://www.youtube.com/watch?v=96dWOEa4Djs shows just how fasts SSDs can be (when RAIDed)
Great!!. Sun Java quickstart was killing my computer (apparently scanning for JRE files) I disabled service and computer works MUCH better.
@Charlie That’s a common one. And I believe when Java is updated that gets re-enabled so make sure you check it occasionally.
Unfortunately, this page http://forum.sysinternals.com/printer_friendly_posts.asp?TID=14424 says it’s not about the disk activity only, but also network and other devices. So my quest for such a disk monitoring tool has not ended yet :(
@lucian Thanks for the info. While I understand your concern, from my experience, whenever I’ve had heavy disk usage the offending process has been at the top when sorted by this column. It has always worked as a disk monitoring tool for me.
This is exactly what I’ve come conclude myself, being the column mentioned by the tool called procexp.exe (process explorer) … but, I’m having two problems :
– The numbers displayed get auto-converted to KB, MB, whatever. If you have a quick changing display, it’s impossible to read, since large numbers (usually the ones with MB’s) do not jump out, next to KB, or whatever.
– There is no graphical display of high disk usage (while there is for CPU usage). It’s obvious procexp is meant for CPU usage, not disk usage, but it would be nice … often, I see my computer being extremely busy, but all is on disk, nothing on CPU, and then the grpahs tell me : all is OK. But I know it isn’t.
DiskMon is not really interesting, it looks like scrolling info only, which may be good for debugging, but not for info.
@t Those are both good points. For the first issue you can slow down the update speed (View -> Update speed) so it’s easier to see them before they change (or you can pause the display). I don’t know of a good solution for the second issue.
My version of process exporer 11.20 has a graphical i/o graph similar to the CPU one.
Check this tool: Free Extended Task Manager – it has a dedicated column Processes/Disk Load. And compared to process explorer I don’t see gmail notifier and yahoo messenger in the top 10 disk users, which leads me to think that compared to process explorer, this is really measuring disk (not all i/o) usage
Cool, thanks for the point lucian.
Thanks for the tip. Very useful.
@Dale77 You’re welcome.
This was a great tool to find out what process is keeping the I/O busy. Have you found any way to drill down to specific files that are causing the I/O?
I have a file server that many users use. Currently trying to figure out exactly which files are taking up the most I/O and causing the whole network to slow down… Haven’t found anything that would show me that.
@Eugene That’s a good question. I haven’t looked yet, but I’m not aware of any tools to do that offhand.
Bravo!! I have been using procexp for quite some time, but never notice the total delta bytes. It will now be a standard setting for me.
Hi,
I am troubleshooting a recommendation from Microsoft – where the Avg disk read\write\trans per sec should be less than 50ms.
i found that several servers – win2003 sp2 standard ed (with similar or different soft installed) – exceeds this value up to values such as 100-200 MS or even 660 ms
my question is the following – how to can analyze processes activities in terms of disk usage?
i want to find which process effects the “disk read\write\trans per sec” the most – can i use this application for this troubleshooting?
thanks in advance for any advise\assistance…
Tamar
@Tamar It would probably work, but procmon can give you even more detailed information about an individual process.
Is Process IO column not the sum of file, network and device IO?
How can you distinct the disk IO only with this column?
@GDS In Process Explorer 14.1 there are three Delta Total Bytes fields
1. Process I/O
2. Process Network
2. Process Disk
Process I/O is not the sum of network and disk. They are 3 distinct values.
I have found the solution on some other forum. It is KB956438, http://support.microsoft.com/kb/956438/en-us
After applying this and rebooting, the problem is gone!!
@Jovke What problem, exactly, is gone?
My computer had slowed to a crawl. Turned out to be indexer. Modified and back to normal.
This post allowed me to set up Process Explorer exactly as I needed to. I have long wanted this feature and, despite being a long-time user of PE, I was not aware that this option existed. Thank you!
@Nick Mash Thanks for your comment, it’s great to hear the post helped you out.
I was hoping to find something to show when one of my external drives were being accessed (because either my sleep mode is broken, or something is constantly doing something to keep it busy).
I do not spot this information in this tool. Is it there and I missed it, or do I have to look elsewhere?
@Linus This method shows the disk usage of processes, regardless of where it is. For instance, I just copied a number of files from my internal hard drive to my external hard drive, and the utility I used to copy (Teracopy) showed up at the top of the Disk Delta Total Bytes.